Lighthouse LabsW4D4 - APIs and Other Data TypesInstructor: Socorro E. Dominguez-Vidana |

|
![]()
Overview:
- [] Introduction to APIs
- [] Using APIs as a data professional
- [] Real-Life Examples
- [] HTTP Requests
- [] Sending requests from different environments
- [] Best practices for working with APIs
- [] Other Data Types
- [] Why is JSON so popular?
- [] JSON vs XML?
- [] Combining Python and Excel
Where Does Our Data Come From?
- Everyday Data: We interact with data constantly—whether we’re looking at our bank account, browsing social media, or searching for a restaurant to eat at.
- Sources of Data: Data can come from many different places, and as a data scientist, understanding these sources is key to solving real-world problems.
- Why It Matters: How we collect data influences what questions we can ask and what insights we can generate.
Meet JasonName: JasonHobby: Hiking, seismology, coding. Goal: Use data to predict earthquakes. |
 Creazilla. (n.d.). Safari guide [Clip art]. Creazilla. |
How can Jason gather the data?
- Public Datasets: Governments and research institutions often provide open data on seismic activity.
- Seismic Networks: Organizations like the Global Seismographic Network (GSN) and local observatories gather seismic data from around the world.
- Historical Records: Libraries, academic institutions, and online archives host datasets on past earthquakes.
- Crowdsourced Data: Platforms like "Did You Feel It?" allow the public to report real-time observations of seismic activity.
- Private Companies: Some tech and insurance companies also collect data for risk analysis and disaster response.
Challenges:
- Data Fragmentation: Data may have inconsistent formats and varying levels of detail.
- Manual Download: Requires manual effort and is time-consuming.
- If Jason wanted to mine data from the web (maybe private companies information):
- Almost all information is irrelevant
- Websites often require interaction (“Load More”, scrolling down)
- When websites update, the code will break
- Every website is different
- Companies actively try to stop data miners; data mining might be illegal.
APIs in Data Science
- Application Programming Interfaces allow data scientists to connect with databases, retrieve data, and automate analysis.
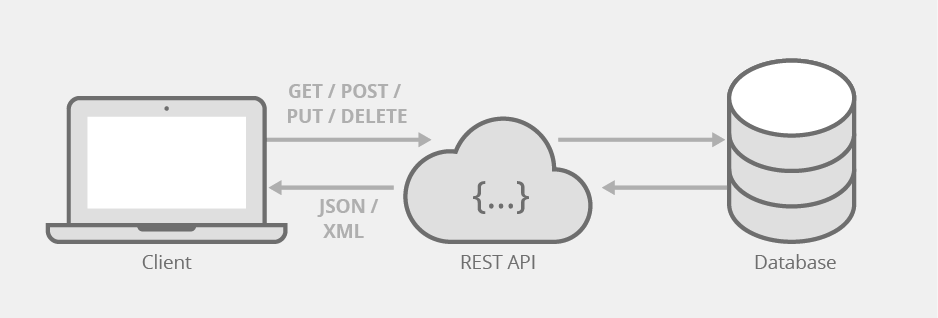
- APIs allow applications to communicate with each other serving as bridges between different data sources.
- Many fields provide open data APIs for accessing information, including weather, finance, and geological data.
- APIs simplify data collection without manually downloading files.
Why use APIs?
- Real-Time Data Access: APIs like the USGS Earthquake API provide up-to-the-minute seismic data, giving Jason instant access to recent earthquake activity.
- Consistency in Data Format: APIs often return data in standardized formats (e.g.,
JSON,CSV,XML), making analysis much simpler. - Data Customization: APIs allow Jason to filter the data by criteria like location, time range, or earthquake magnitude, ensuring he gets only the data relevant to his analysis.
- Automation Capabilities: Instead of manually checking data repositories, Jason can automate the process to continuously gather new data with scripts.
Representational State Transfer (REST)
- Stateless: Each API call is independent, with all necessary information included in the request.
- Resource-Based: Interactions revolve around resources, identified by URIs.
- Use of HTTP (Hypertext Transfer Protocol) Methods:
- GET: retrieve (the only one you will have access to right now.)
- POST: create
- PUT: update
- DELETE: remove
Accessing Seismic Data via the USGS Earthquake API
Jason's new BFF: Documentation
In [1]:
import requests
In [2]:
url = "https://earthquake.usgs.gov/fdsnws/event/1/query"
In [3]:
params = {
    'format': 'geojson',
    'starttime': '1023-01-01',
    'endtime': '2024-10-02',
    'latitude': 36.77,
    'longitude': -119.41,
    'maxradius': 50,
    'minmagnitude': 5,
    'limit': 2000
}
In [4]:
response = requests.get(url, params=params)
response
Out[4]:
<Response [200]>
In [5]:
data = response.json()
In [6]:
response.url
Out[6]:
'https://earthquake.usgs.gov/fdsnws/event/1/query?format=geojson&starttime=1023-01-01&endtime=2024-10-02&latitude=36.77&longitude=-119.41&maxradius=50&minmagnitude=5&limit=2000'
In [7]:
#data
Jason can extracts relevant data such as magnitude and location for analysis using other python libraries such as matplotlib and pandas
In [8]:
import pandas as pd
import matplotlib.pyplot as plt
In [9]:
features = data['features']
df = pd.json_normalize(features)
df.head(3)
Out[9]:
| type | id | properties.mag | properties.place | properties.time | properties.updated | properties.tz | properties.url | properties.detail | properties.felt | ... | properties.types | properties.nst | properties.dmin | properties.rms | properties.gap | properties.magType | properties.type | properties.title | geometry.type | geometry.coordinates | |
|---|---|---|---|---|---|---|---|---|---|---|---|---|---|---|---|---|---|---|---|---|---|
| 0 | Feature | us7000ngxr | 5.1 | 207 km WSW of Pistol River, Oregon | 1727492655149 | 1728530066400 | NaN | https://earthquake.usgs.gov/earthquakes/eventp... | https://earthquake.usgs.gov/fdsnws/event/1/que... | 12.0 | ... | ,dyfi,internal-moment-tensor,moment-tensor,nea... | 69.0 | 1.910 | 1.35 | 213.0 | mww | earthquake | M 5.1 - 207 km WSW of Pistol River, Oregon | Point | [-126.8404, 41.8543, 10] |
| 1 | Feature | us7000ngr0 | 5.1 | 84 km SW of Corinto, Nicaragua | 1727408371854 | 1727444129040 | NaN | https://earthquake.usgs.gov/earthquakes/eventp... | https://earthquake.usgs.gov/fdsnws/event/1/que... | NaN | ... | ,internal-moment-tensor,moment-tensor,origin,p... | 70.0 | 1.021 | 0.93 | 135.0 | mww | earthquake | M 5.1 - 84 km SW of Corinto, Nicaragua | Point | [-87.6523, 11.8785, 51.404] |
| 2 | Feature | us7000ngme | 5.0 | 4 km NW of San Miguel Totolapan, Mexico | 1727377382951 | 1727447850638 | NaN | https://earthquake.usgs.gov/earthquakes/eventp... | https://earthquake.usgs.gov/fdsnws/event/1/que... | 12.0 | ... | ,dyfi,origin,phase-data, | 134.0 | 1.636 | 0.97 | 158.0 | mb | earthquake | M 5.0 - 4 km NW of San Miguel Totolapan, Mexico | Point | [-100.4196, 18.1862, 70.492] |
3 rows × 30 columns
In [10]:
df['magnitude'] = df['properties.mag']
df['place'] = df['properties.place']
df['time'] = pd.to_datetime(df['properties.time'], unit='ms')
In [11]:
plt.figure(figsize=(12, 6))
plt.scatter(df['time'], df['magnitude'], alpha=0.5)
plt.title('Magnitude of Earthquakes in California Over the Last 12 Years')
plt.xlabel('Date')
plt.ylabel('Magnitude')
plt.xticks(rotation=45)
plt.grid()
plt.show()

Where is the USGS data really stored?
- The USGS API provides access to a (possibly) SQL database of earthquake events collected and maintained by the USGS.
- The data originates from various seismic networks and is updated in near real-time.
- The database is not publicly accessible in the sense that you cannot download it and query it to your liking.
- Each call that you do to the API possibly triggers a SQL function that yields the information back to you.

Disclaimer: Can Data Science Predict Earthquakes?
- Short answer: Not yet. And Domain Expertise is crucial.
- Earthquakes are caused by tectonic movements, but predicting the exact time and location remains a challenge.
- Jason wants to use data science tools like machine learning to find patterns in seismic data.
- Jason will need to work closely with geologists and seismologists to ensure his models are scientifically accurate.
From Terminal, a Browser, and Postman
!curl -G "https://earthquake.usgs.gov/fdsnws/event/1/query" \
--data-urlencode "format=geojson" \
--data-urlencode "starttime=1924-10-01" \
--data-urlencode "endtime=2024-10-01" \
--data-urlencode "latitude=36.7783" \
--data-urlencode "longitude=-119.4179" \
--data-urlencode "maxradius=50" \
--data-urlencode "minmagnitude=0.0" \
--data-urlencode "limit=1"
Working with Paid APIs and Authentication Keys
- The API will requires an Authentication Key
- Register on the API provider’s website to obtain access.
- After account creation, navigate to the API settings or dashboard.
- Locate the section for generating API keys or tokens.
- Follow the instructions to create a new key.
- Read the API Documentation
import requests

url = "https://api.fakeusgs.com/v1/seismic"

# Keep your API secure using environment variables
api_key = os.getenv("WEATHER_API_KEY")

# Parameters
params = {
    "latitude": 10,
    "longitude": 80,
    "limit": 100}

# Headers
headers = {
    "Authorization": f"Bearer {api_key}",
    "Accept": "application/json" }

response = requests.get(url, headers=headers, params=params)
Appendix I: Common HTTP Status Codes
- 200 OK: Success.
- 204 No Content: No content.
- 400 Bad Request: Invalid syntax.
- 401 Unauthorized: Authentication is required and has failed/not been provided.
- 403 Forbidden: The server cannot authorize it.
- 404 Not Found: The resource was not found on the server.
- 500 Internal Server Error: The server could not fulfil the request.
Other Data Formats
| Data Format | Example | What are we trying to use it for? |
|---|---|---|
| Text | Tweets, scripts, books | Sentiment analysis, other NLP |
| JSON or XML | Parsing APIs | Gather data, data ingestion process, trend analysis, forecasting |
| HTML | Web scraping | Get information where APIs are not available. |
| Images | Computer vision | Self-driving cars, building custom shoes, X-rays - diagnostics |
Different data, different tools
- Tabular data:
pandas,SQL - XML:
xml - JSON:
json - HTML:
BeautifulSoup
JSON vs XML
| Feature | JSON | XML |
|---|---|---|
| Syntax | Uses braces {} and brackets [] |
Nested tags <> |
| Verbosity | Less verbose | Complex |
| Data Types | Supports arrays and objects natively | Requires additional attributes for lists |
| Parsing | Easier to parse with built-in functions | Requires a parser for XML structure |
| Human Readability | Easier for humans to read and write | More complex structure can be harder to read |
| Use Cases | APIs and configuration | Document storage and data interchange |
| XML | JSON | ||||||
|---|---|---|---|---|---|---|---|
<earthquakes>
  <earthquake>
    <magnitude>4.5</magnitude>
    <location>10 km N of Turlock, CA </location>
    <date>2021-09-01</date>
  </earthquake>
</earthquakes>
|
{
  "earthquakes": {
    "earthquake": {
      "magnitude": 4.5,
      "location": "10 km N of Turlock, CA",
      "date": "2021-09-01"
    }
  }
}
|
||||||
| Tabular | |||||||
|
|||||||
Why Save Data After Downloading from an API
- Data Integrity: Preserve a stable copy in case of API changes or outages.
- Performance: Faster local access improves application efficiency.
- Flexibility: Enables easier manipulation and analysis without API constraints.
XML and BeautifulSoup
- Explore XML files with the
xmlorBeautifulSouppackage. - Data file provided:
toy_data.xmlandusgs_data.xml
In [12]:
import xml.etree.ElementTree as et
In [13]:
tree = et.parse('data/toy_data.xml')
tree
Out[13]:
<xml.etree.ElementTree.ElementTree at 0x10f64e790>
In [14]:
# Gets the tree root tag
root = tree.getroot()
root
Out[14]:
<Element 'seismic_data' at 0x1171798f0>
In [15]:
root.tag
Out[15]:
'seismic_data'
From the root, we can begin to navigate the tree
In [16]:
# get root tag
print("What is the root tag:", root.tag)

# get root attributes
print("Attributes of the root tag:", root.attrib)

# get number of "children"
print("Number of children:", len(root))
What is the root tag: seismic_data
Attributes of the root tag: {}
Number of children: 3
In [17]:
for idx in range(len(root)):
    print("tag:", root[idx].tag, "| attribute:", root[idx].attrib)
tag: earthquake | attribute: {'id': '1', 'type': 'moderate'}
tag: earthquake | attribute: {'id': '2', 'type': 'light'}
tag: earthquake | attribute: {'id': '3', 'type': 'strong'}
In [18]:
x = root[0].attrib
In [19]:
x['type']
Out[19]:
'moderate'
In [20]:
import xmltodict
In [21]:
with open('data/toy_data.xml', 'r') as file:
    xml_data = file.read()
In [22]:
xml_data
Out[22]:
'<?xml version="1.0"?>\n<seismic_data>\n <earthquake id="1" type="moderate">\n <magnitude>4.5</magnitude>\n <location>10 km N of Turlock, CA</location>\n <date>2021-09-01</date>\n <depth>10</depth> <!-- in kilometers -->\n <coordinates>\n <latitude>36.7783</latitude>\n <longitude>-119.4179</longitude>\n </coordinates>\n </earthquake>\n <earthquake id="2" type="light">\n <magnitude>5.1</magnitude>\n <location>20 km S of San Jose, CA</location>\n <date>2022-06-15</date>\n <depth>15</depth> <!-- in kilometers -->\n <coordinates>\n <latitude>37.3349</latitude>\n <longitude>-121.8890</longitude>\n </coordinates>\n </earthquake>\n <earthquake id="3" type="strong">\n <magnitude>6.0</magnitude>\n <location>30 km SW of Los Angeles, CA</location>\n <date>2023-01-10</date>\n <depth>20</depth> <!-- in kilometers -->\n <coordinates>\n <latitude>33.9490</latitude>\n <longitude>-118.4040</longitude>\n </coordinates>\n </earthquake>\n</seismic_data>\n'
In [23]:
data_dict = xmltodict.parse(xml_data)
data_dict.keys()
Out[23]:
dict_keys(['seismic_data'])
In [24]:
from bs4 import BeautifulSoup
In [25]:
soup = BeautifulSoup(xml_data, 'lxml-xml')
In [26]:
soup.find_all('earthquake')[1]
Out[26]:
<earthquake id="2" type="light">
<magnitude>5.1</magnitude>
<location>20 km S of San Jose, CA</location>
<date>2022-06-15</date>
<depth>15</depth> <!-- in kilometers -->
<coordinates>
<latitude>37.3349</latitude>
<longitude>-121.8890</longitude>
</coordinates>
</earthquake>
JSON
- Explore JSON files with the
jsonandpandas. - Data file provided:
toy_data.jsonandusgs_data.json
In [27]:
import pandas as pd

file = 'data/toy_data.json'
json_data = pd.read_json(file)
json_data
Out[27]:
| seismic_data | |
|---|---|
| 0 | {'region': 'California', 'earthquake_data': [{... |
| 1 | {'region': 'Nevada', 'earthquake_data': [{'ear... |
| 2 | {'earthquake_data': [{'earthquakes': [{'magnit... |
pd.read_jsondoesn't always work with nested JSON files...- You may encounter
ValueErrorsas it tries to create apd.DataFrame
In [28]:
from IPython.display import JSON
import pprint
import json
In [29]:
with open('data/toy_data.json') as file:
    data = json.load(file)
In [30]:
#pprint.pprint(data)
In [31]:
# Just Jupyter Lab
JSON(data)
Out[31]:
<IPython.core.display.JSON object>
In [32]:
pd.json_normalize(data)
Out[32]:
| seismic_data | |
|---|---|
| 0 | [{'region': 'California', 'earthquake_data': [... |
In [33]:
data.keys()
Out[33]:
dict_keys(['seismic_data'])
In [34]:
df = pd.json_normalize(data['seismic_data'],
                       record_path=['earthquake_data', 'earthquakes'],
                       meta=['region'],  # Meta data at the higher level
                       meta_prefix='_',  # Prefix for clarity
                       errors='ignore') # Explore ignore/raise
df
Out[34]:
| magnitude | location | date | _region | |
|---|---|---|---|---|
| 0 | 4.5 | 10 km N of Turlock, CA | 2021-09-01 | California |
| 1 | 3.8 | 15 km N of Los Angeles, CA | 2021-10-01 | California |
| 2 | 4.2 | 5 km S of Reno, NV | 2021-11-01 | Nevada |
| 3 | 3.9 | 20 km W of Las Vegas, NV | 2021-12-01 | Nevada |
| 4 | 4.1 | 30 km N of Fresno, CA | 2021-11-15 | NaN |
Other approaches
In [35]:
flattened_data = []

for region_info in data['seismic_data']:
    region = region_info.get('region', 'Unknown')
    for earthquake_data in region_info.get('earthquake_data', []):
        for earthquake in earthquake_data.get('earthquakes', []):
            flattened_entry = {
                'magnitude': earthquake['magnitude'],
                'location': earthquake['location'],
                'date': earthquake['date'],
                'region': region
            }
            flattened_data.append(flattened_entry)
pd.DataFrame(flattened_data)
Out[35]:
| magnitude | location | date | region | |
|---|---|---|---|---|
| 0 | 4.5 | 10 km N of Turlock, CA | 2021-09-01 | California |
| 1 | 3.8 | 15 km N of Los Angeles, CA | 2021-10-01 | California |
| 2 | 4.2 | 5 km S of Reno, NV | 2021-11-01 | Nevada |
| 3 | 3.9 | 20 km W of Las Vegas, NV | 2021-12-01 | Nevada |
| 4 | 4.1 | 30 km N of Fresno, CA | 2021-11-15 | Unknown |
Other forms of tabular data
In [36]:
import pandas as pd
import openpyxl
In [37]:
data_xlsx = pd.read_excel('data/toy_tabular.xlsx')
data_xlsx
Out[37]:
| Table 1 | Unnamed: 1 | |
|---|---|---|
| 0 | NaN | NaN |
| 1 | Owner of Data: | Geo Jason |
Excel Files
- As a Data Analyst and Scientist, you need to know both.
- It is not a competition.
- Excel files can be very practical and widely understood/used.
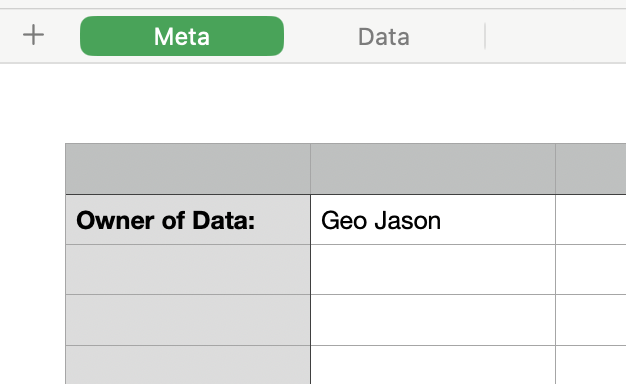
- After exploring the file, we know that the data is on
Tab 2
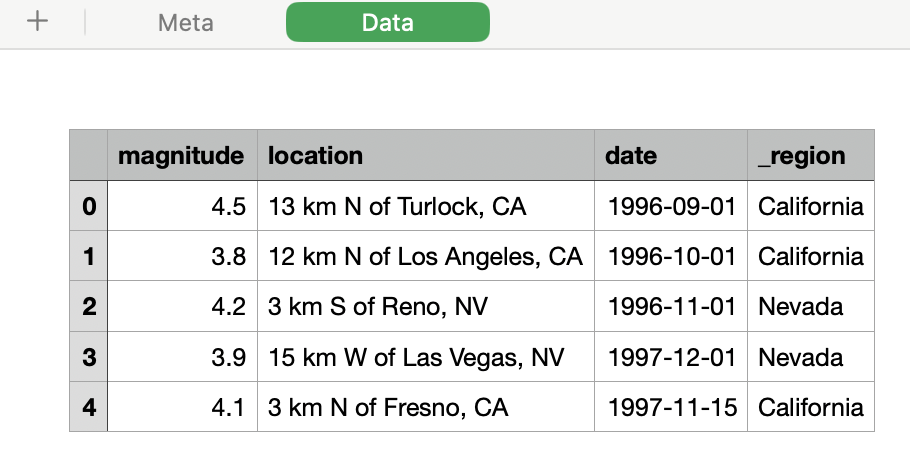
In [38]:
data_xlsx = pd.read_excel('data/toy_tabular.xlsx',
                          sheet_name='Data',
                          header=1,
                          usecols='B:E',
                          engine = 'openpyxl')
data_xlsx
Out[38]:
| magnitude | location | date | _region | |
|---|---|---|---|---|
| 0 | 4.5 | 13 km N of Turlock, CA | 1996-09-01 | California |
| 1 | 3.8 | 12 km N of Los Angeles, CA | 1996-10-01 | California |
| 2 | 4.2 | 3 km S of Reno, NV | 1996-11-01 | Nevada |
| 3 | 3.9 | 15 km W of Las Vegas, NV | 1997-12-01 | Nevada |
| 4 | 4.1 | 3 km N of Fresno, CA | 1997-11-15 | California |
Useful Links
Gulati, A. (2021, April 20). All Pandas json_normalize you should know for flattening JSON. Towards Data Science. https://towardsdatascience.com/all-pandas-json-normalize-you-should-know-for-flattening-json-13eae1dfb7dd