Lighthouse LabsW2D5 - Analyzing DataInstructor: Socorro E. Dominguez-Vidana |

|
Follow with ![]()
Overview
- [] What is Data Analysis
- [] Aggregate Functions in
SQL - [] The
HAVINGclause - [] Examples
Data Analysis
Turning raw data into meaninful insights.
Data analysis is the process of examining, cleaning, transforming, and interpreting data to find useful information, suggest conclusions, and support decision-making.
The Data Analysis Cycle
- Data Question/Problem:
- Start with a clear question or problem to solve.
- Example: "Which products are performing best this quarter?"
- A well-defined problem guides the entire analysis and ensures focus.
- Data Collection:
- Gather the data needed to answer the question (from databases, APIs, surveys, etc.).
- Data Cleaning:
- Remove duplicates
- Handle missing values
- Correct inconsistencies in the dataset.
- Data Transformation:
- Format data for consistency.
- Convert data into the right format or structure for analysis (e.g., normalization, aggregation).
- Create new features or categories relevant to the problem.
- Data Analysis:
- Perform statistical or machine learning methods to explore patterns, relationships, and trends.
- Methods vary depending on the type of data and question:
| Type of Question | Technique to Use | Example |
|---|---|---|
| What are the patterns or trends in my data? | Exploratory Data Analysis (EDA) | Use visualizations like bar charts or line plots to examine sales trends over time. |
| Is there a relationship between variables? | Correlation or Regression Analysis | Analyze if there's a correlation between marketing spend and customer acquisition. |
| How can I predict future outcomes? | Predictive Modeling (Regression, Classification) | Build a regression model to predict future sales based on historical data. |
| What groups or segments exist in my data? | Clustering (K-means, Hierarchical Clustering) | Use K-means clustering to segment customers into different behavior groups. |
| What factors are the most important? | Feature Importance (Decision Trees, Random Forest) | Use a decision tree to identify which factors most influence customer churn. |
| What are the probabilities of an event? | Probability Models (Logistic Regression) | Use logistic regression to predict the probability of a customer churning. |
- Insights & Interpretation:
- Interpret the results, connect them to the original problem, and make data-driven decisions.
- The goal is to transform results into actionable insights.
- Example:
a) Insight: "Our best-performing product is X."
b) Decision: "Increase production and marketing budget for Product X." - Communicate insights clearly with visuals (graphs, charts) and actionable recommendations.
Introduction to Data Transformations
Data transformation is the process of converting raw data into a format that is easier to analyze or interpret.
Common transformations include filtering data, grouping data, and applying aggregations.
SQLis a powerful tool to perform these transformations.Two essential
SQLtools for this areGROUP BYand aggregation functions.
Scenario:
You have been hired as a Data Analyst for a company that manages product sales across four regions: North, South, East, and West. The company is keen on understanding how different products perform in each region and how customers behave in terms of their purchasing patterns.
Your will work with these two tables:
sales_data: This table tracks product sales, including information about the product, the region where the sale occurred, the amount of the sale, and the date of the sale.
customer_orders: This table keeps track of customer purchases, including the customer ID, the amount they spent on each order, and the date of the order.
Sales_data
| Column | Data Type | Description |
|---|---|---|
| product_id | INTEGER | ID of the product (1-10 different products) |
| region | TEXT | Region where the sale occurred (North, South, East, West) |
| sale_amount | INTEGER | Amount of the sale (between US50 and US1000) |
| sale_date | TEXT | Date of the sale (randomly chosen within a 30-day range starting from 2023-10-01) |
customer_orders
| Column | Data Type | Description |
|---|---|---|
| customer_id | INTEGER | ID of the customer (1-50 different customers) |
| order_amount | INTEGER | Amount of the order (between US50 and US2000) |
| order_date | TEXT | Date of the order (randomly chosen within a 30-day range starting from 2023-10-01) |
%load_ext sql
%sql sqlite:///data/large_sqlite_db.db
%%sql
SELECT * FROM sales_data
LIMIT 2;
 * sqlite:///data/large_sqlite_db.db
Done.
| product_id | region | sale_amount | sale_date |
|---|---|---|---|
| 5 | North | 507 | 2023-10-18 |
| 10 | North | 126 | 2023-10-02 |
%%sql
SELECT * FROM customer_orders
LIMIT 2;
 * sqlite:///data/large_sqlite_db.db
Done.
| customer_id | order_amount | order_date |
|---|---|---|
| 18 | 1459 | 2023-10-22 |
| 5 | 1497 | 2023-10-08 |
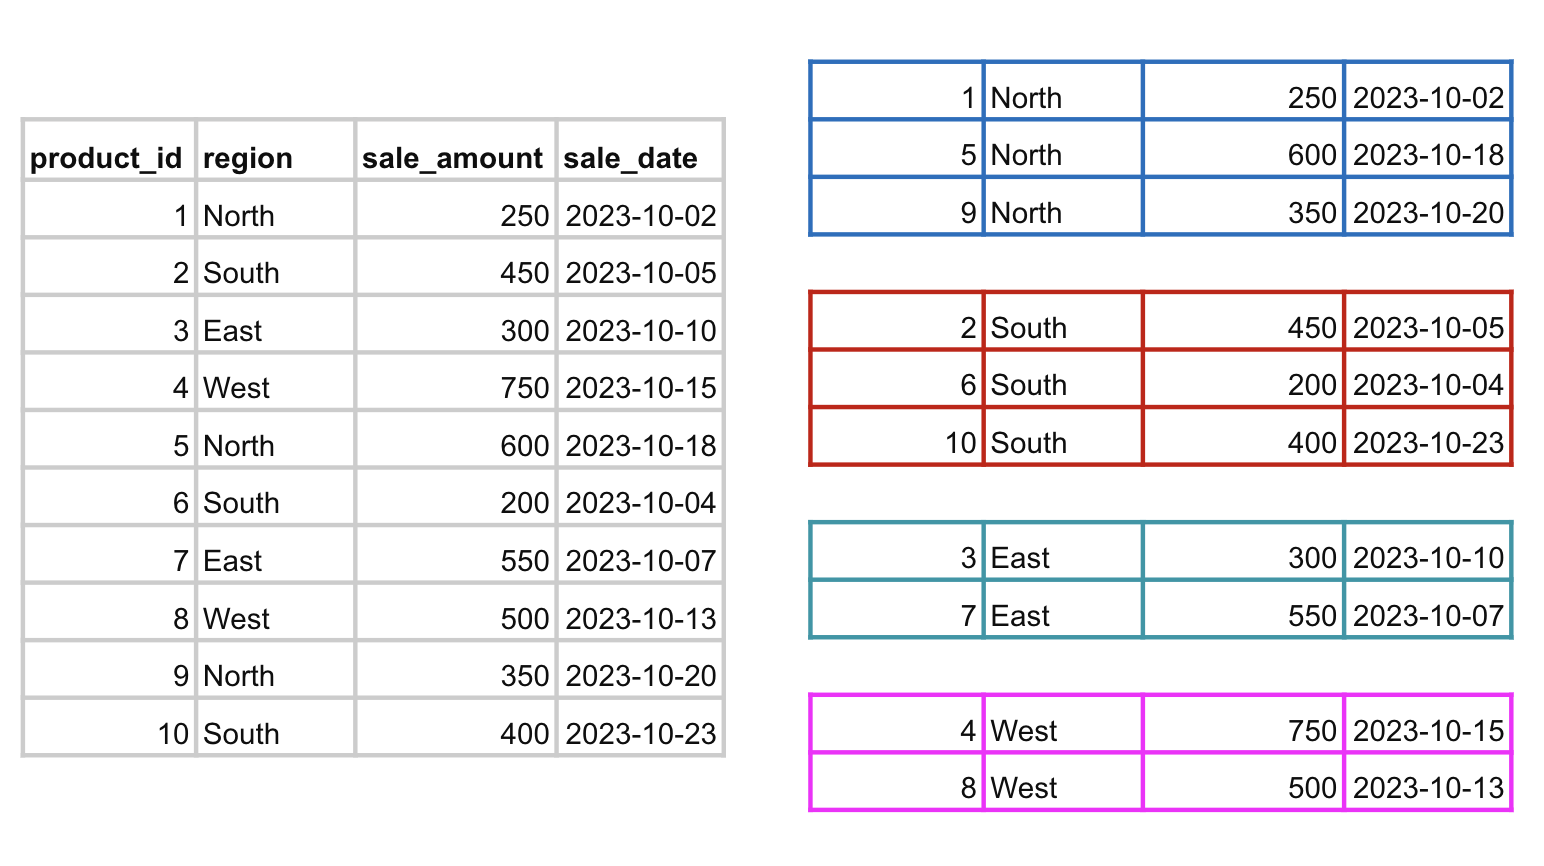
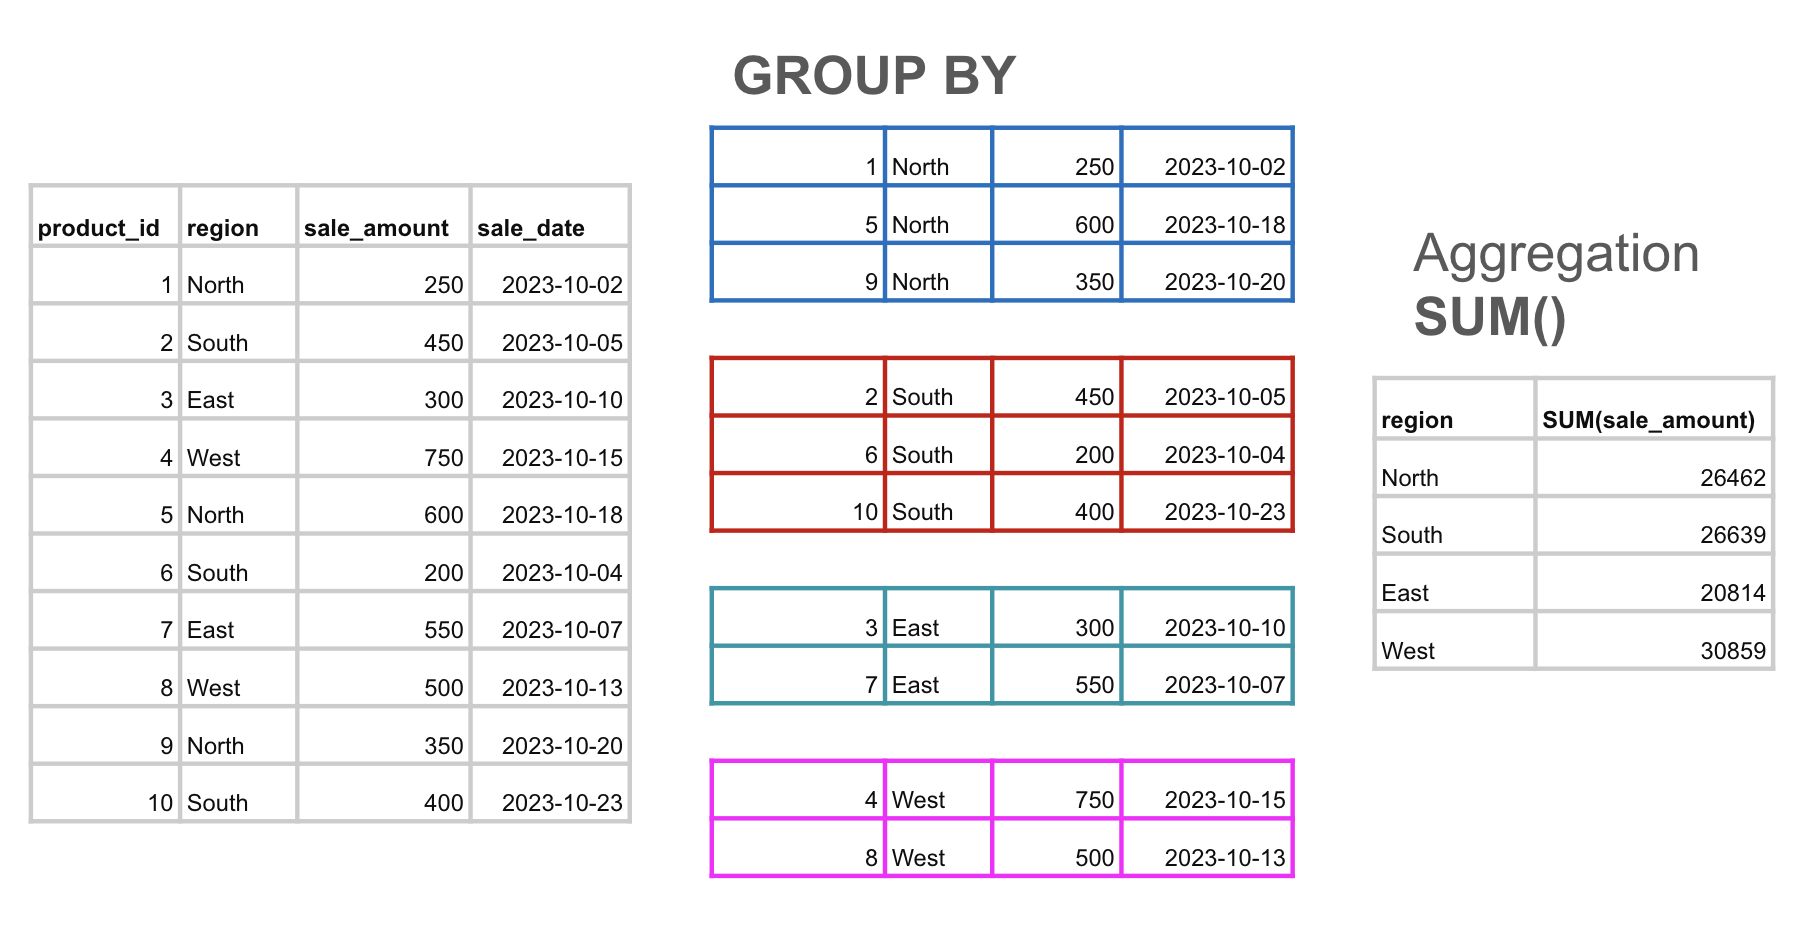
Imagine I want to see the purchase orders by region:
Query:
SELECT region, SUM(sale_amount)
FROM sales_data
GROUP BY region;
GROUP BY in SQL
- The
GROUP BYclause groups rows that have the same values in specified columns into summary rows. GROUP BYis essential when you want to perform aggregate calculations (e.g., sums, averages) for each group of data.- When using
GROUP BY, you need to include columns that will define how the data should be grouped. Every non-aggregated column in theSELECTstatement must also appear in theGROUP BY. - The
GROUP BYclause groups the data by region. However, for each region, itsumsthe sale_amount thanks to the aggregation functionsum()in theSELECTstatement. If we do not pass an aggregation function, we may receive an error (depending on theSQLengine we are using.)
%%sql

SELECT region, SUM(sale_amount)
FROM sales_data
GROUP BY region;
 * sqlite:///data/large_sqlite_db.db
Done.
| region | SUM(sale_amount) |
|---|---|
| East | 20814 |
| North | 26462 |
| South | 26639 |
| West | 30859 |
Since I am using sqlite, it picks one value for sale_amount per region group without aggregating it, which can lead to unpredictable results. Postgres would yield an error.
Aggregation Functions in SQL (15 minutes)
Key Aggregation Functions:
SUM(): Adds up all the values in a group.- Total sales for each region.
AVG(): Calculates the average value for a group.- Average sale amount per product.
COUNT(): Counts the number of rows in a group. - How many sales were made in each region?MIN()andMAX(): Finds the minimum and maximum value in a group. - What was the smallest and largest sale in a day?
Examples
%%sql
--SUM and AVG

SELECT product_id, SUM(sale_amount) AS total_sales, AVG(sale_amount) AS avg_sales
FROM sales_data
GROUP BY product_id;
 * sqlite:///data/large_sqlite_db.db
Done.
| product_id | total_sales | avg_sales |
|---|---|---|
| 1 | 10559 | 555.7368421052631 |
| 2 | 9092 | 478.5263157894737 |
| 3 | 9983 | 453.77272727272725 |
| 4 | 11263 | 536.3333333333334 |
| 5 | 11189 | 559.45 |
| 6 | 10270 | 604.1176470588235 |
| 7 | 11131 | 556.55 |
| 8 | 13444 | 584.5217391304348 |
| 9 | 8304 | 437.05263157894734 |
| 10 | 9539 | 476.95 |
Filtering Groups with HAVING
- Difference between
WHEREandHAVING:WHEREfilters rows before grouping, whileHAVINGfilters groups after the aggregation.WHEREcannot use aggregate functions likeSUM(), butHAVINGcan.
Example:
Suppose you only want to see regions where the total sales are greater than $30,000:
%%sql

SELECT region, SUM(sale_amount) AS total_sales
FROM sales_data
GROUP BY region
HAVING SUM(sale_amount) > 30000;
 * sqlite:///data/large_sqlite_db.db
Done.
| region | total_sales |
|---|---|
| West | 30859 |
HAVING is like a post-filter, it filters the result of the grouping process.
Combining GROUP BY, Aggregation functions, and HAVING for Data Analysis Insights
Let’s say a company wants to identify which products are generating significant revenue but only in the regions where total sales exceed $5000.
%%sql
SELECT product_id, region, SUM(sale_amount) AS total_sales
FROM sales_data
GROUP BY product_id, region
HAVING SUM(sale_amount) > 5000;
 * sqlite:///data/large_sqlite_db.db
Done.
| product_id | region | total_sales |
|---|---|---|
| 4 | North | 5189 |
| 8 | North | 5898 |
- This groups by both product_id and region, sums the sales, and filters out groups where total sales do not exceed $5000.
- Insights from this query could guide decisions on which regions to focus marketing efforts.
Calculate the total and average order_amount for each customer and filter customers who have spent more than $500 on average.
%%sql
SELECT customer_id, SUM(order_amount) AS total_spent, AVG(order_amount) AS avg_order
FROM customer_orders
GROUP BY customer_id
HAVING AVG(order_amount)> 1300;
 * sqlite:///data/large_sqlite_db.db
Done.
| customer_id | total_spent | avg_order |
|---|---|---|
| 2 | 2687 | 1343.5 |
| 5 | 4966 | 1655.3333333333333 |
| 15 | 2636 | 1318.0 |
| 21 | 5614 | 1403.5 |
| 23 | 5422 | 1355.5 |
| 33 | 10560 | 1320.0 |
| 35 | 2899 | 1449.5 |
| 45 | 3093 | 1546.5 |
| 48 | 6273 | 1568.25 |
| 50 | 5433 | 1358.25 |
Exercise 1: Sales per Region per Month
Objective: Group by region and sale_date to calculate the total sales for each region, broken down by month.
Expected Output:
| region | sale_month | total_sales |
|---|---|---|
| North | 2023-10 | 3500 |
| South | 2023-10 | 4500 |
| East | 2023-10 | 3000 |
| West | 2023-10 | 5000 |
%%sql
UsageError: %%sql is a cell magic, but the cell body is empty. Did you mean the line magic %sql (single %)?
Exercise 2: Filter Regions with High Total Sales
Objective: Use the HAVING clause to filter groups based on aggregated values.
Task:
Find regions where the total sales are greater than $30000. Use the HAVING clause to filter the groups.
Expected Output:
| region | total_sales |
|---|---|
| North | 3500 |
| West | 4500 |
%%sql
UsageError: %%sql is a cell magic, but the cell body is empty. Did you mean the line magic %sql (single %)?
Exercise 3: Products with Sales Greater than Average
Objective: Use GROUP BY and HAVING to identify products whose total sales are above the overall average sales across all products.
Task:
First, calculate the overall average sales across all products. Then, find the product_ids where the total sales for that product are greater than this average.
Expected Output:
| product_id | total_sales |
|---|---|
| 2 | 6500 |
| 3 | 7200 |
| 5 | 7500 |
%%sql
UsageError: %%sql is a cell magic, but the cell body is empty. Did you mean the line magic %sql (single %)?
Exercise 5: Combine Sales and Customer Data (JOIN)
Find the total number of products sold per customer who has spent more than $3000 in total (combine sales_data and customer_orders using a JOIN). Group by customer_id and filter customers using the HAVING clause.
Expected Output:
| customer_id | total_products_sold |
|---|---|
| 12 | 50 |
| 18 | 65 |
%%sql
UsageError: %%sql is a cell magic, but the cell body is empty. Did you mean the line magic %sql (single %)?
Conclusions
GROUP BYhelps organize data into subsets.- Aggregation functions (
SUM(),AVG(),COUNT(), etc.) summarize these subsets. HAVINGis used to filter groups after aggregation, similar toWHEREbut applied at the group level.